|
|
|
Coupon Statistics
General Facts about Coupons
Coupon clippers have taken over the checkout lines in record numbers...with record savings. But if you still think most coupon users have blue hair, you're way off. With mobile and internet coupons gaining even more popularity discounted prices are a hot hobby across all ages and incomes, especially folks in their 20s and 30s. If you've been hiding your frugal habits, it's time to let your lean lifestyle shine! Just how much of an influence do coupons have on the population at large? Check out the latest stats on coupon usage trends below.
- 79.8% of consumers regularly shopped with coupons in 2012, compared to 63.6% during pre-recession 2007.
- 4.4% of the 305 billion coupons distributed in 2012 were for non-food categories such as medications, personal care and other household products.
- 2.9 billion coupons were redeemed in 2012, saving consumers a collective $800 million in discounts.
- The average value of a coupon in 2012 was $1.53 overall, a penny less than in 2010 and 2011.
- 29% of all coupons distributed in 2012 required the purchase of two or more products, while 45% of all food coupons required the purchase of two or more items.
- The average expiration date for coupons in 2012 was 9.3 weeks, down from 9.9 weeks in 2011.
- 46% of shoppers cited lack of coupons for products they buy as the reason personal coupon usage dropped between 2011 and 2012.
- 43.9% of coupons redeemed in 2012 were from free-standing inserts, compared to 88% over 20 years ago.
- 39% of smartphone owners use their devices to redeem mobile coupons in-store, compared to just 10% of tablet users.
- The number of mobile coupon users has jumped 10% since 2010.
- Shoppers are three times more likely to scan a barcode in exchange for a mobile coupon than respond to a text.
- Approximately 25 million Americans use mobile coupon apps each month.
- Mobile coupons are 10 times more likely to be redeemed than traditional coupons.
- Mobile coupon redemption through tablets and smartphones is expected to reach 10 billion in 2013, up from less than 5 billion in 2012.
- In 2011, 21% of shoppers searched for coupons while in-store.
- In 2011, 37% off smartphone users redeemed location-based coupons, while 42% more expressed interest in doing so.
- Overall, mobile and online coupon redemption exceeds traditional newspaper coupon redemption.
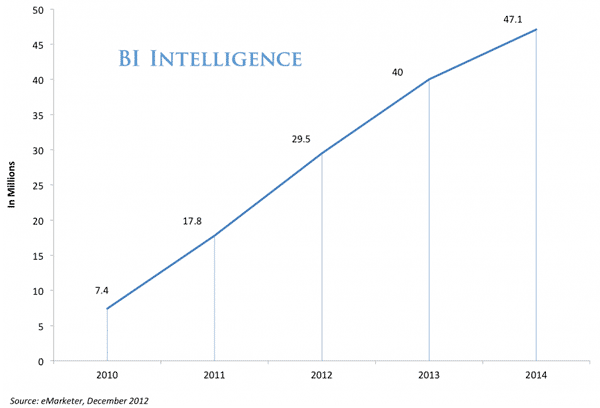
- In 2010, 7.4 million Americans used mobile coupons on their smartphones. That number more than tripled to 29.5 million in 2012 and is expected to reach 47.1 million in 2014.
- In 2012, 54% of travelers were expected to search for coupons while on vacation.
- In 2011, 33% of men and 47% of women identified social media as their primary source for coupons.
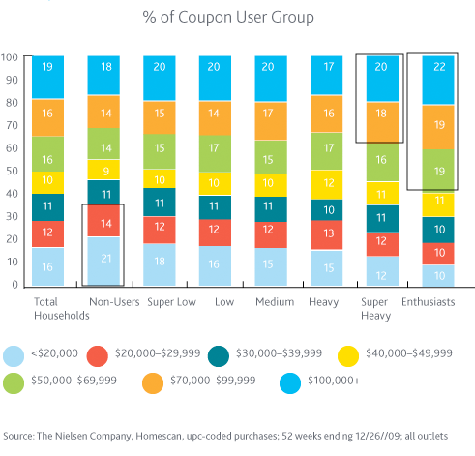
- Households earning over $100,000 annually are twice as likely to coupon than families who make under $35,000 annually.
- In 2012, coupon distribution amounted to $1,535 savings potential per person in the U.S. However, actual coupon redemption equaled just $10.75 savings per person.
- Nearly two-thirds of consumers use coupons for more than half their shopping trips.
- One-third of shoppers will not use a coupon if it requires them to purchase multiple items.
- In 2012, 10% of the estimated 1.35 billion coupons printed from home were redeemed.
- 47% of surveyed shoppers collected discounts through coupon websites in 2012.
- In 2012, 80% of consumers indicated they “feel smarter” when they use coupons.
- 20% of shoppers find coupon policies confusing.
- 78% of surveyed consumers would prefer coupons be automatically applied to their purchases.
- 37% of surveyed shoppers want all coupons to be digital.
- The average value of food coupons distributed in 2012 was $1.06, down 5.4% from 2011.
- The value of coupons distributed for non-food items in 2012 was $1.91, representing a 0.5% increase over 2011.
- Coupon sites receive a collective 48 million visitors each month.
- 47% of surveyed shoppers want retailers to send them a coupon while they’re in-store or nearby.
- 24.8% of coupons redeemed in the food category were consumer relations coupons. These coupons are often free, high-value coupons sent in response to customer feedback.
U.S. Smart Phone Mobile Coupon Users

Coupon Users Based on Income Brackets

Redemption Growth for Different Coupon Types in 2009
- Internet - 263%
- Direct Mail - 69%
- Magazine Pop-up - 51%
- Instant Redeemable - 48%
- Electronic Checkout - 39%
- Free-standing Insert - 36%
- Digital Promotions - 31%
- Shelf Pad - 30%
- In Store Advertisement - 27%
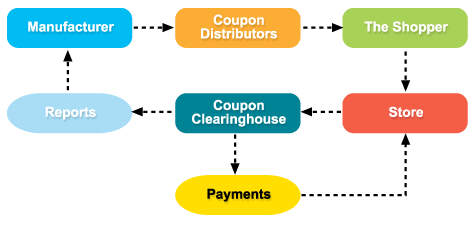
How Manufacturers Coupons Work

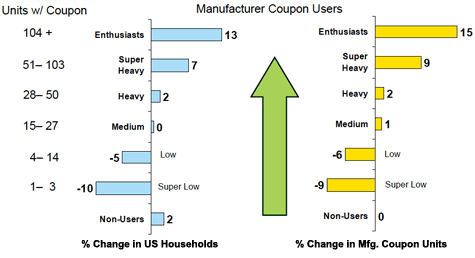
Increasing Trends in Coupon Usage

Sources:
- Valassis / NCH Marketing Resources
- Nielsen
- Mad Mobile News
- Business Insider
- Microsoft Tag
- Internet Retailer
- JiWire
- Dave Ramsey
- Inmar
- comScore
|
|
|


